Coordinate grid paper
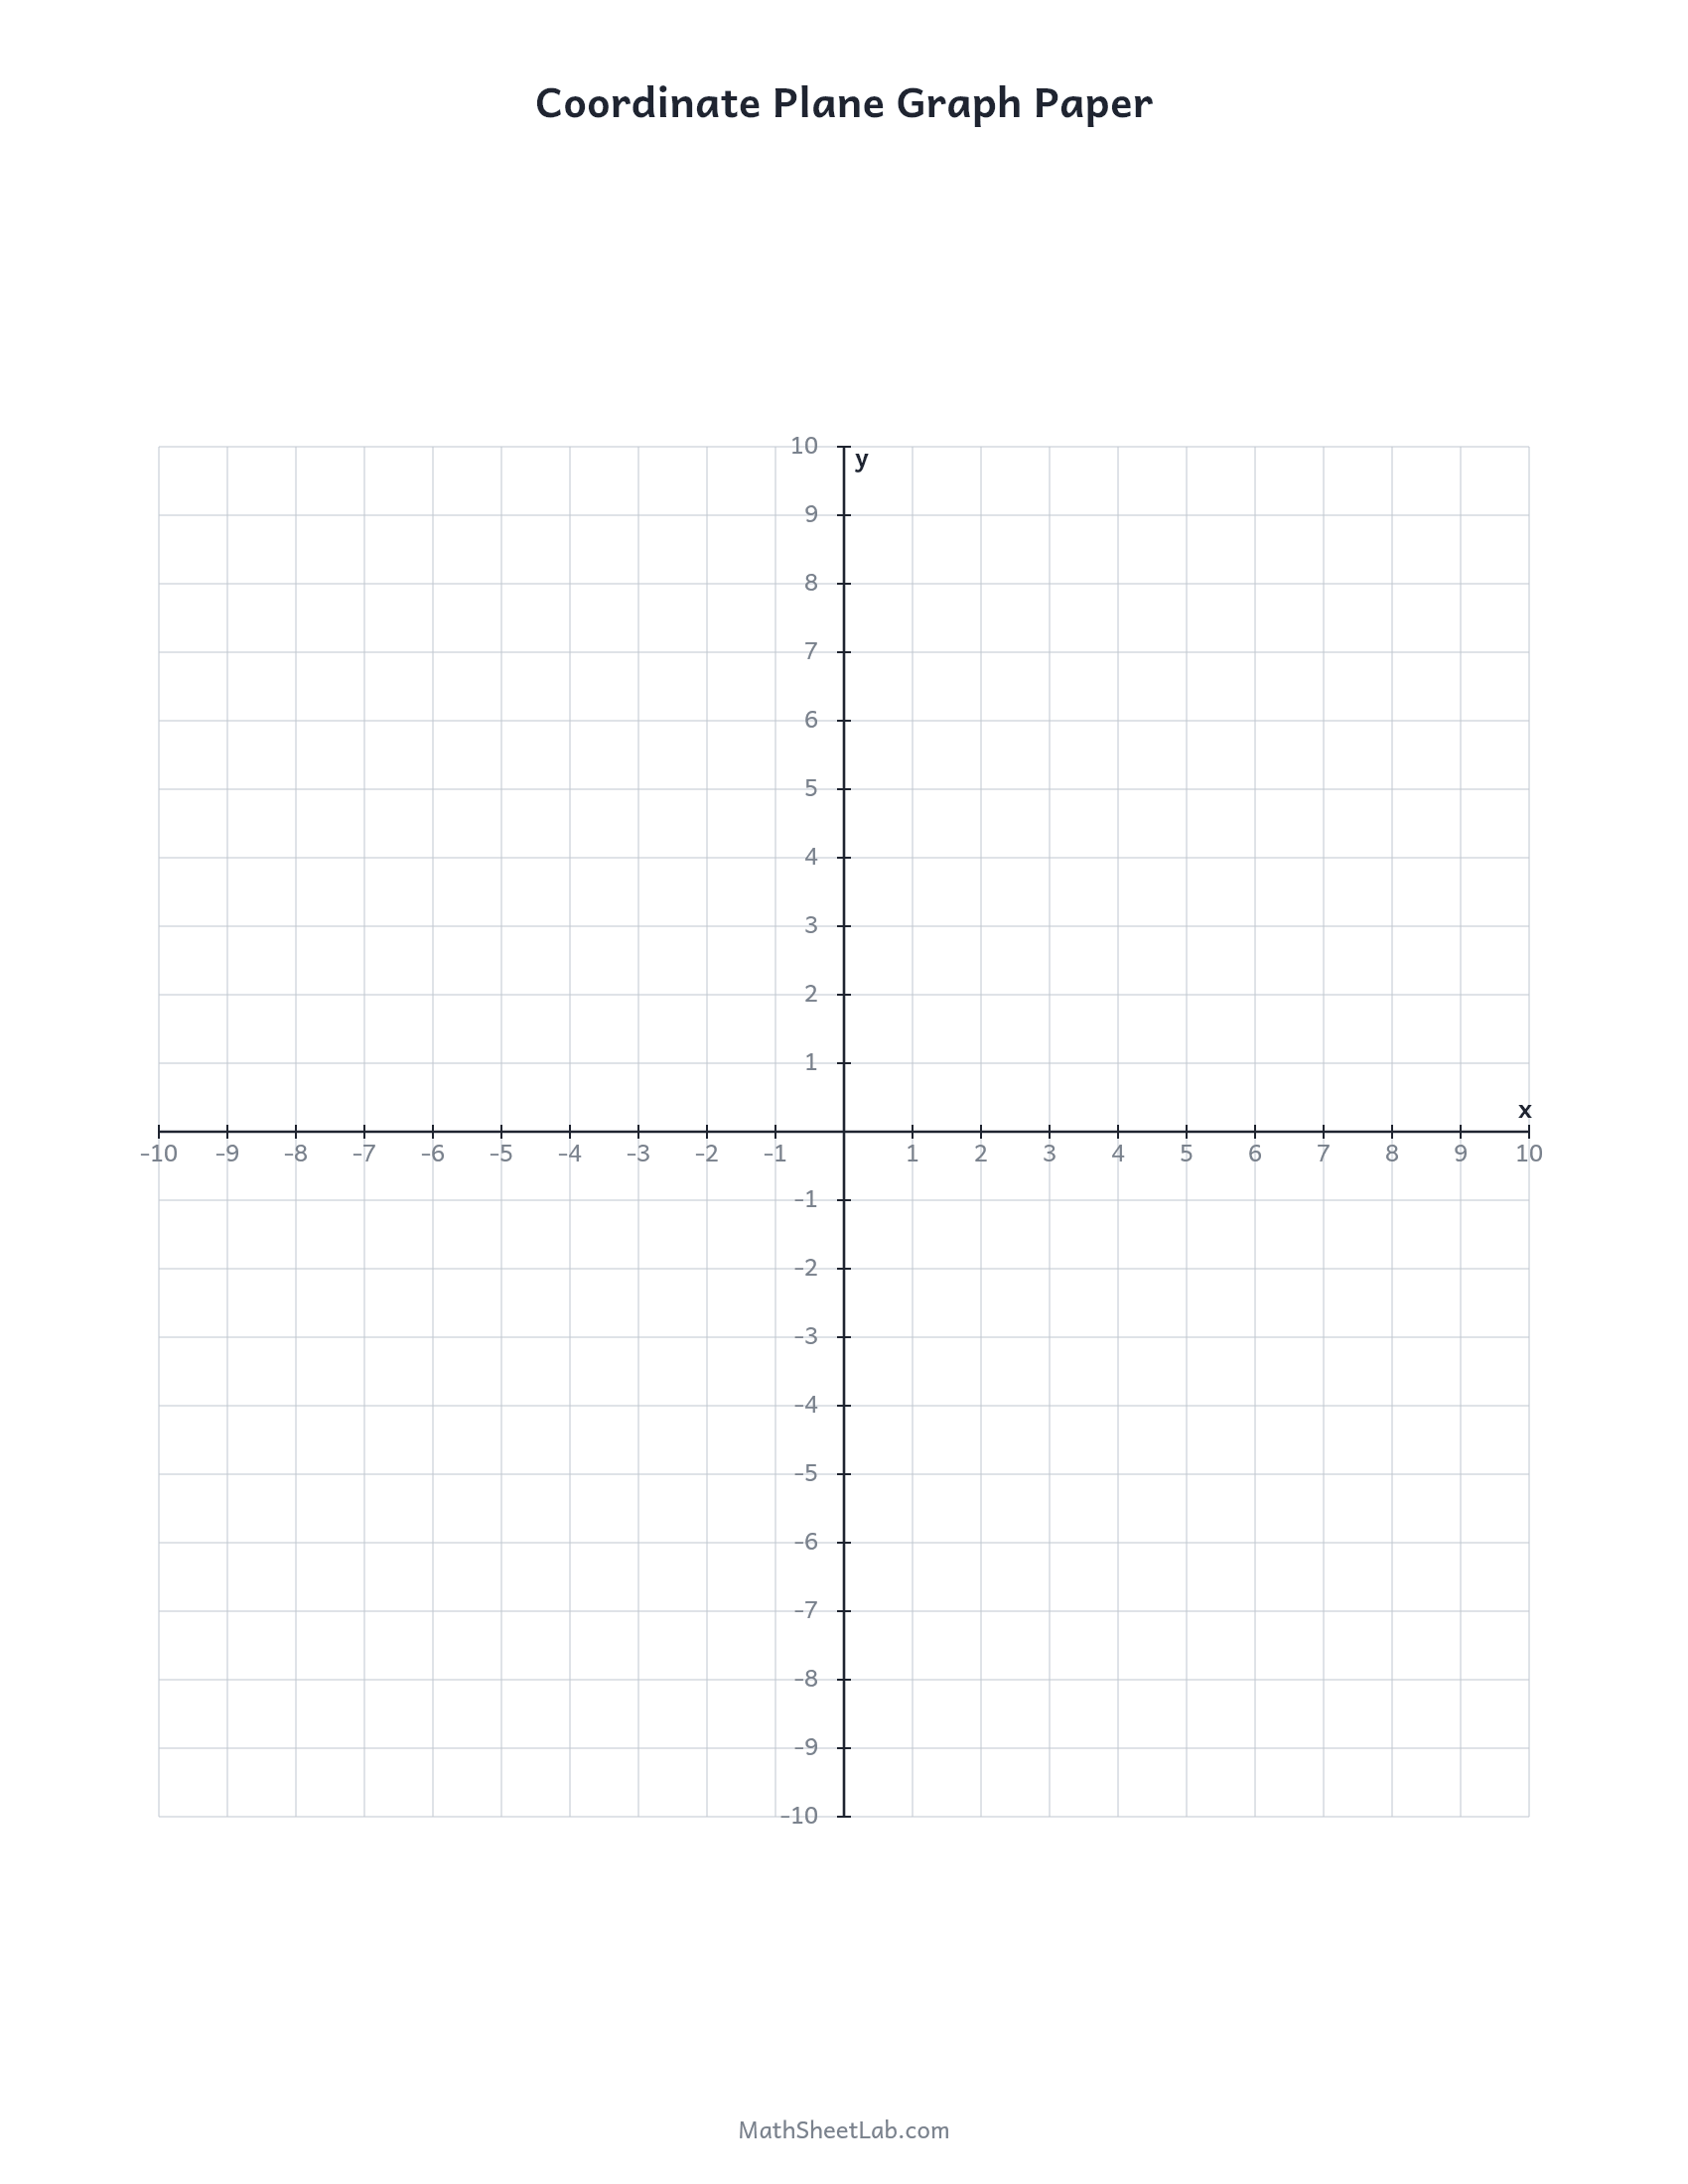
A numbered four-quadrant coordinate grid, ready for plotting points and graphing lines, in a full-page version and a four-grids-per-page version.
Both versions
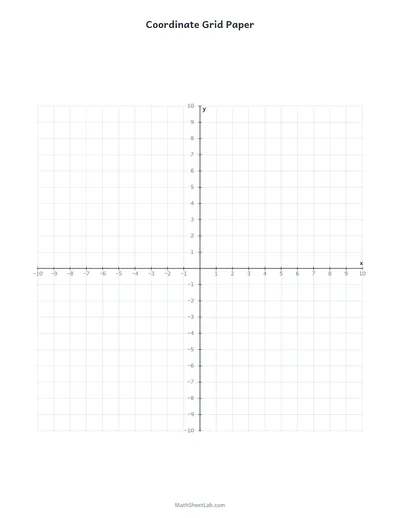
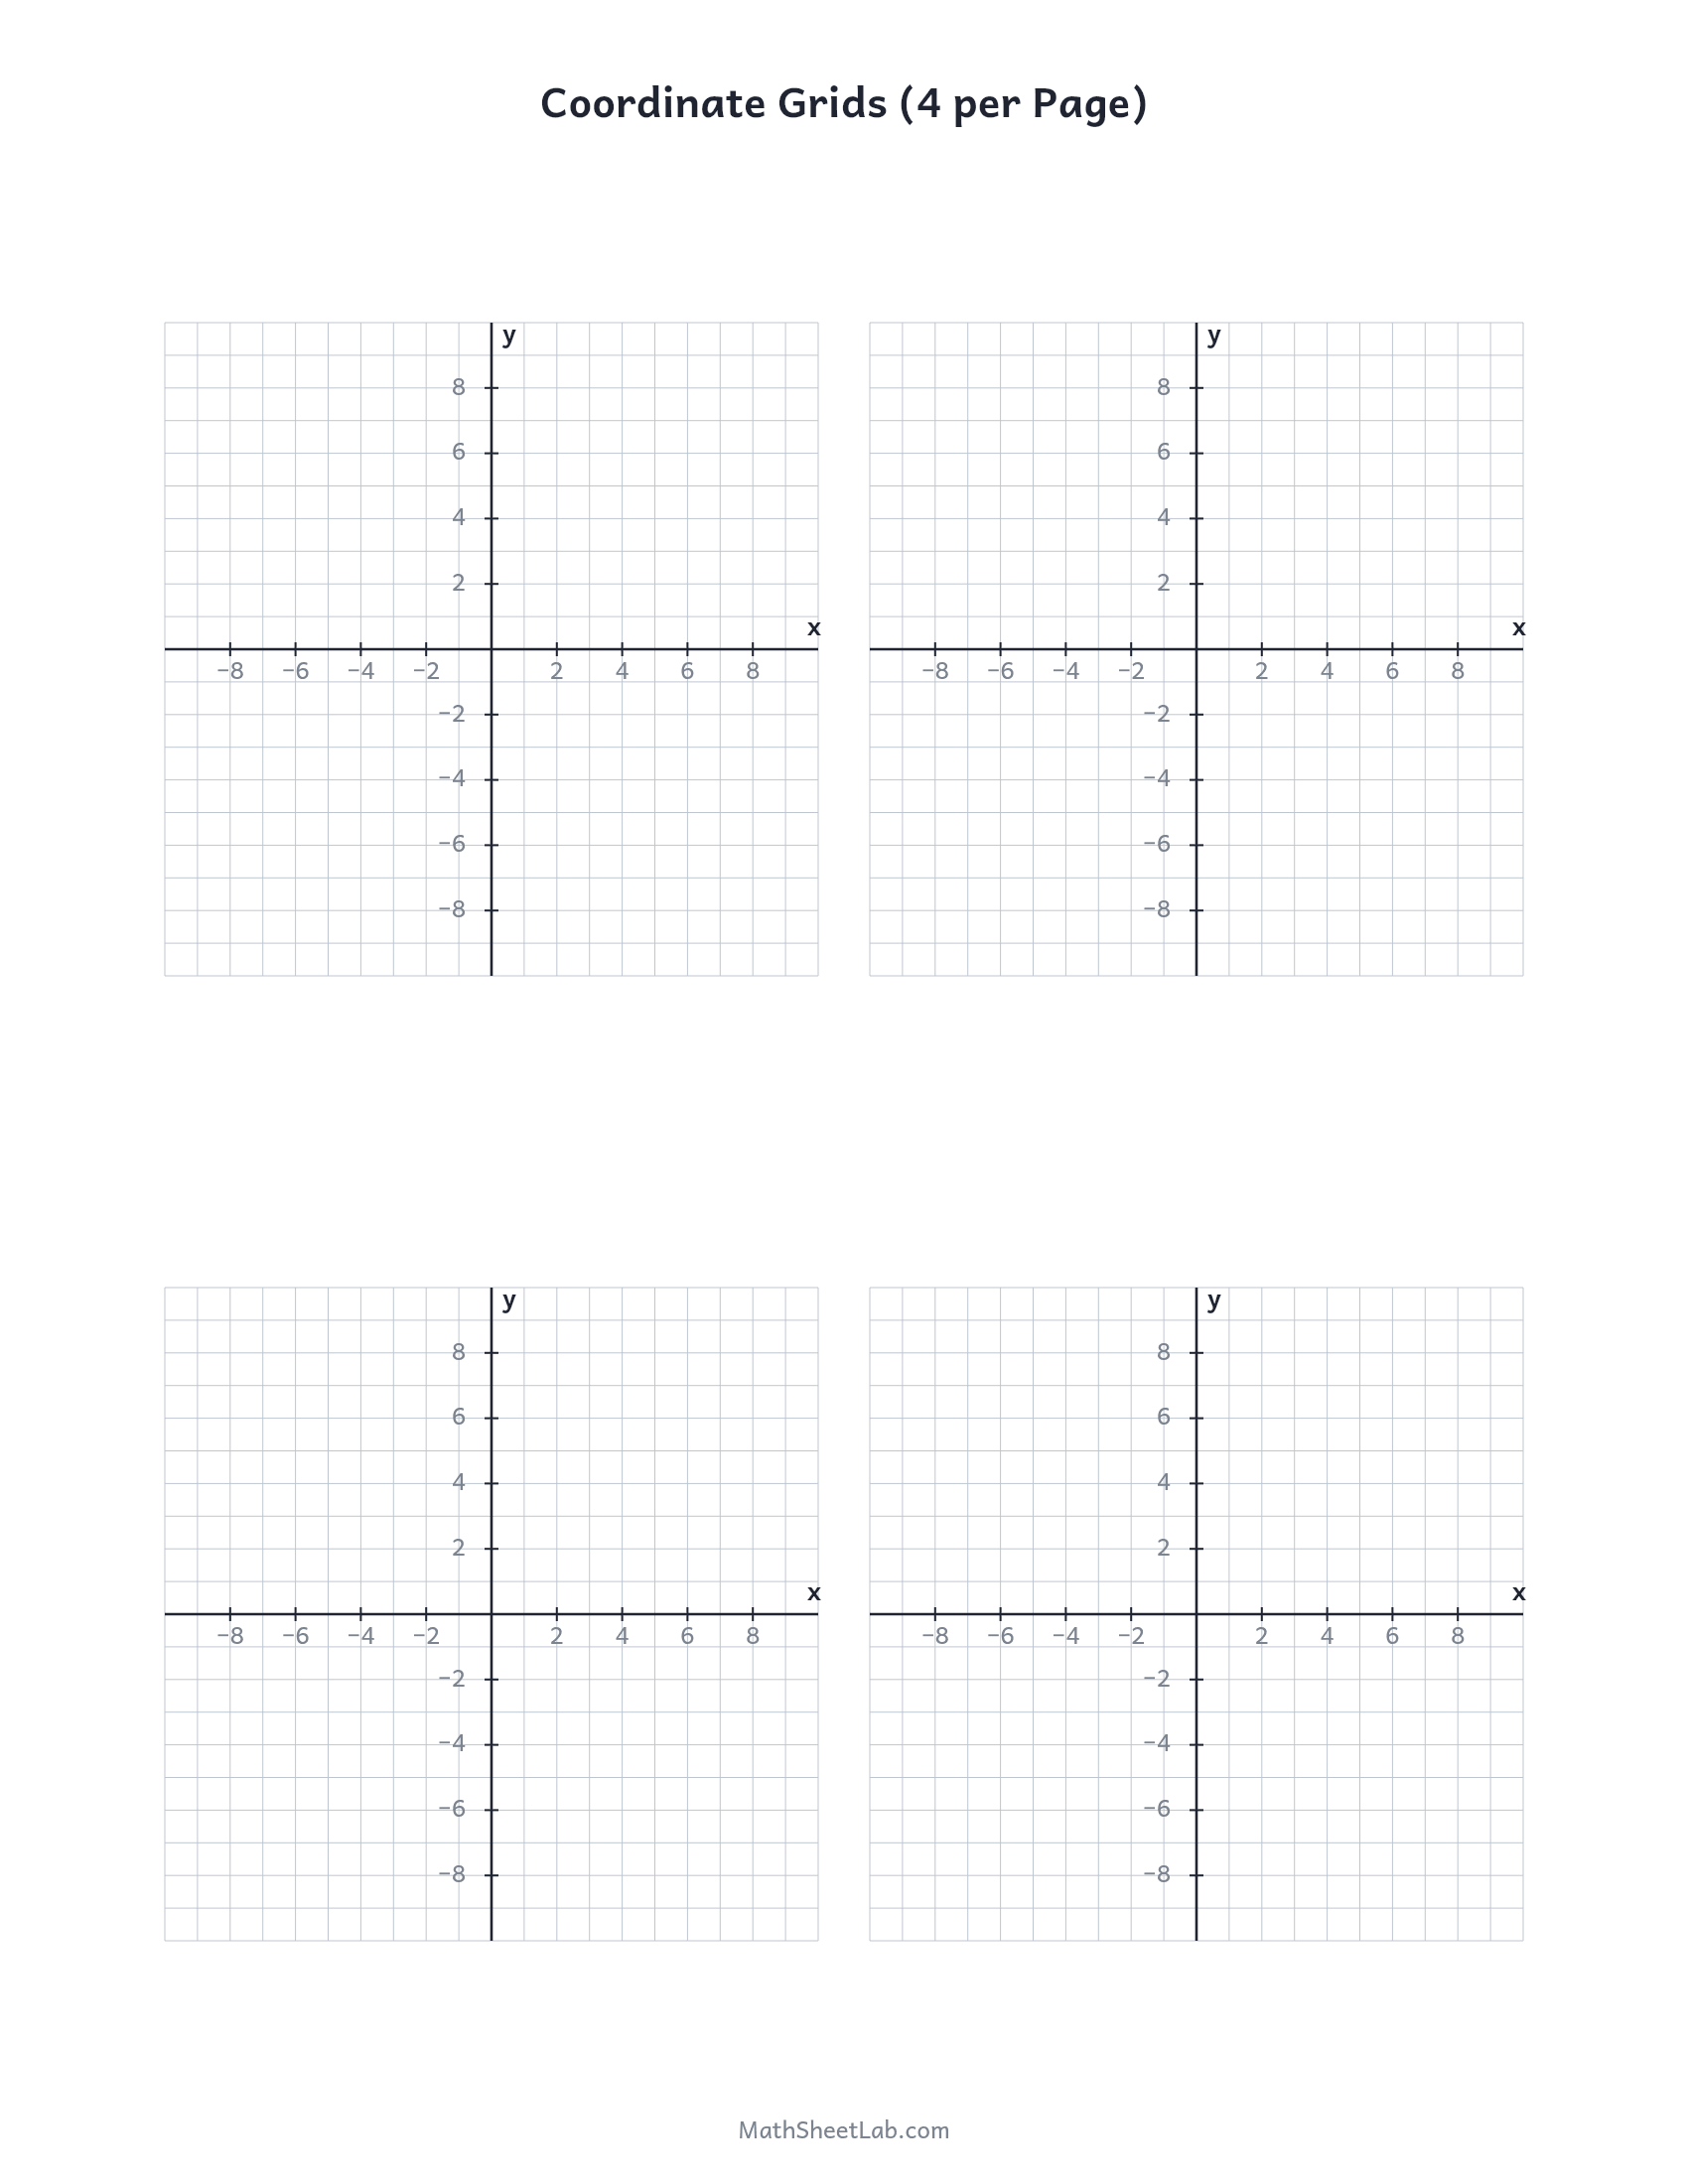
Page 1 is a single full-page grid for graphing lines; page 2 fits four smaller grids on one sheet, which is the layout most plotting homework uses.
-
One big grid
-
Four grids per page
How to print it
- Open the print view. Press Print for a clean print-ready view of page 1, or download it as a PDF or PNG. The other pages are in the gallery below, with a button to download them all.
- Fit to page. In the print dialog choose “Fit to page” — the chart is laid out for US Letter and scales cleanly onto A4.
- Copy freely. Print or photocopy as many as you need for home, classroom or tutoring use. It is free, with no sign-up.
About the coordinate grid paper
A coordinate grid is the same thing as a coordinate plane: two numbered axes crossing at the origin (0, 0), with a square grid behind them so points can be plotted exactly. Both axes on these grids run from -10 to 10, so students can plot ordered pairs and graph linear equations without drawing their own grid first. The x-axis runs across and the y-axis up, dividing the page into four quadrants numbered counterclockwise from the top right. Use the four-per-page sheet for short plotting exercises and the full page for graphing lines and shapes, in middle-school math or early algebra.
Frequently asked questions
Is a coordinate grid the same as a coordinate plane?
Yes. Teachers use the two names for the same thing: numbered x- and y-axes crossing at the origin, over a square grid. Coordinate plane is the more formal term.
What range do these grids cover?
Both axes run from -10 to 10, with every whole number marked on the full-page grid. The smaller four-per-page grids label every second number so the digits stay readable.
How do you plot a point on it?
Read the x-coordinate first and move that far along the horizontal axis, then move the y-coordinate up or down. The point (3, -2) is three right and two down.
Which quadrant is which?
Quadrant I is the top right, then they number counterclockwise: II top left, III bottom left, IV bottom right.