Addition chart (1–10)
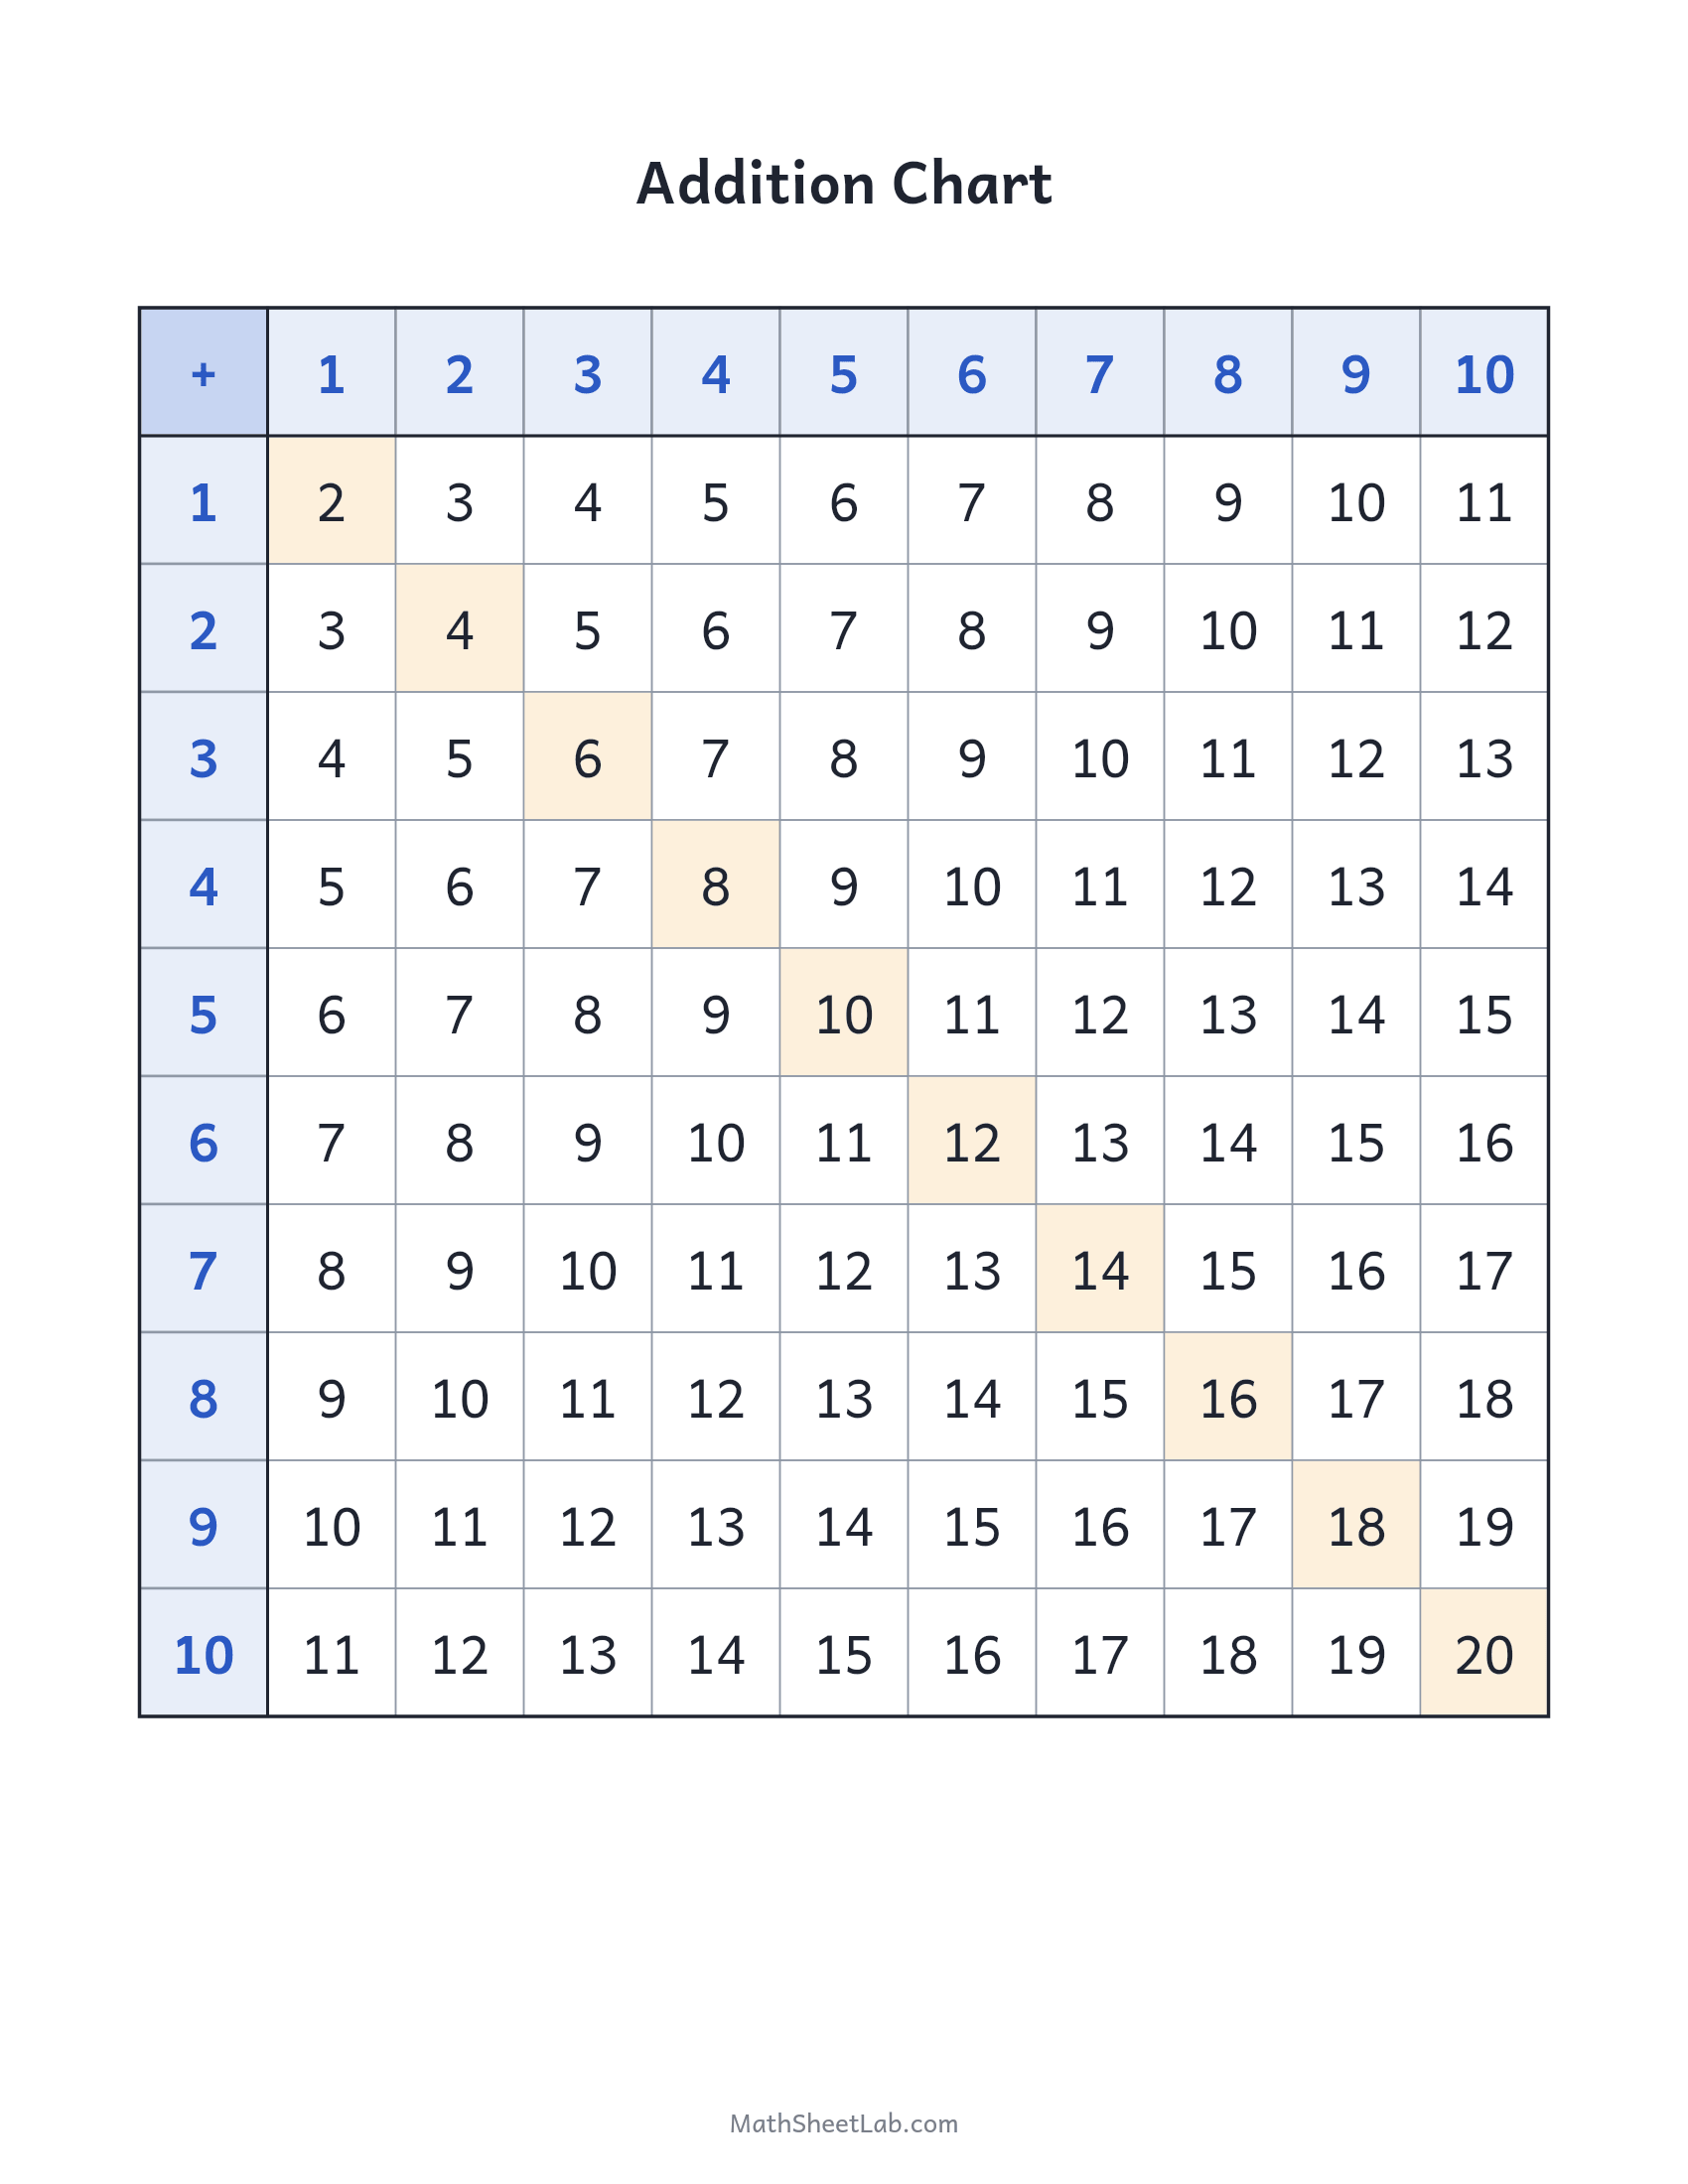
Every addition fact from 1+1 to 10+10 in one grid — the addition version of the times table chart.
How to print it
- Open the print view. Press Print for a clean print-ready view, or download the PDF or PNG below the chart.
- Fit to page. In the print dialog choose “Fit to page” — the chart is laid out for US Letter and scales cleanly onto A4.
- Copy freely. Print or photocopy as many as you need for home, classroom or tutoring use. It is free, with no sign-up.
About the addition chart
An addition chart works exactly like a multiplication chart: one addend down the side, the other across the top, the sum where they meet. The shaded diagonal marks the doubles (2, 4, 6 … 20), which are the anchor facts most children learn first — from there, "doubles plus one" covers the neighboring cells. Ideal for kindergarten to 2nd grade while addition facts within 20 are being built.
Grade level: this chart is used in our 1st grade math worksheets collection.
Frequently asked questions
How does an addition chart help?
It makes fact families visible: children see that 3+7 and 7+3 land on the same answer, and that each row simply counts on by one — patterns that speed up recall.
What are the shaded cells?
The doubles — 1+1, 2+2, up to 10+10. Doubles are usually the first facts to stick, and they anchor nearby facts like 6+7 (“double 6, plus 1”).
What grade is this chart for?
Mainly K–2, while addition facts within 20 are being learned. It also supports older students who need a reference during independent work.