Tally chart
How tally marks work, with a blank tally chart to fill in, then a second page with a frequency column and a finished class survey to copy from.
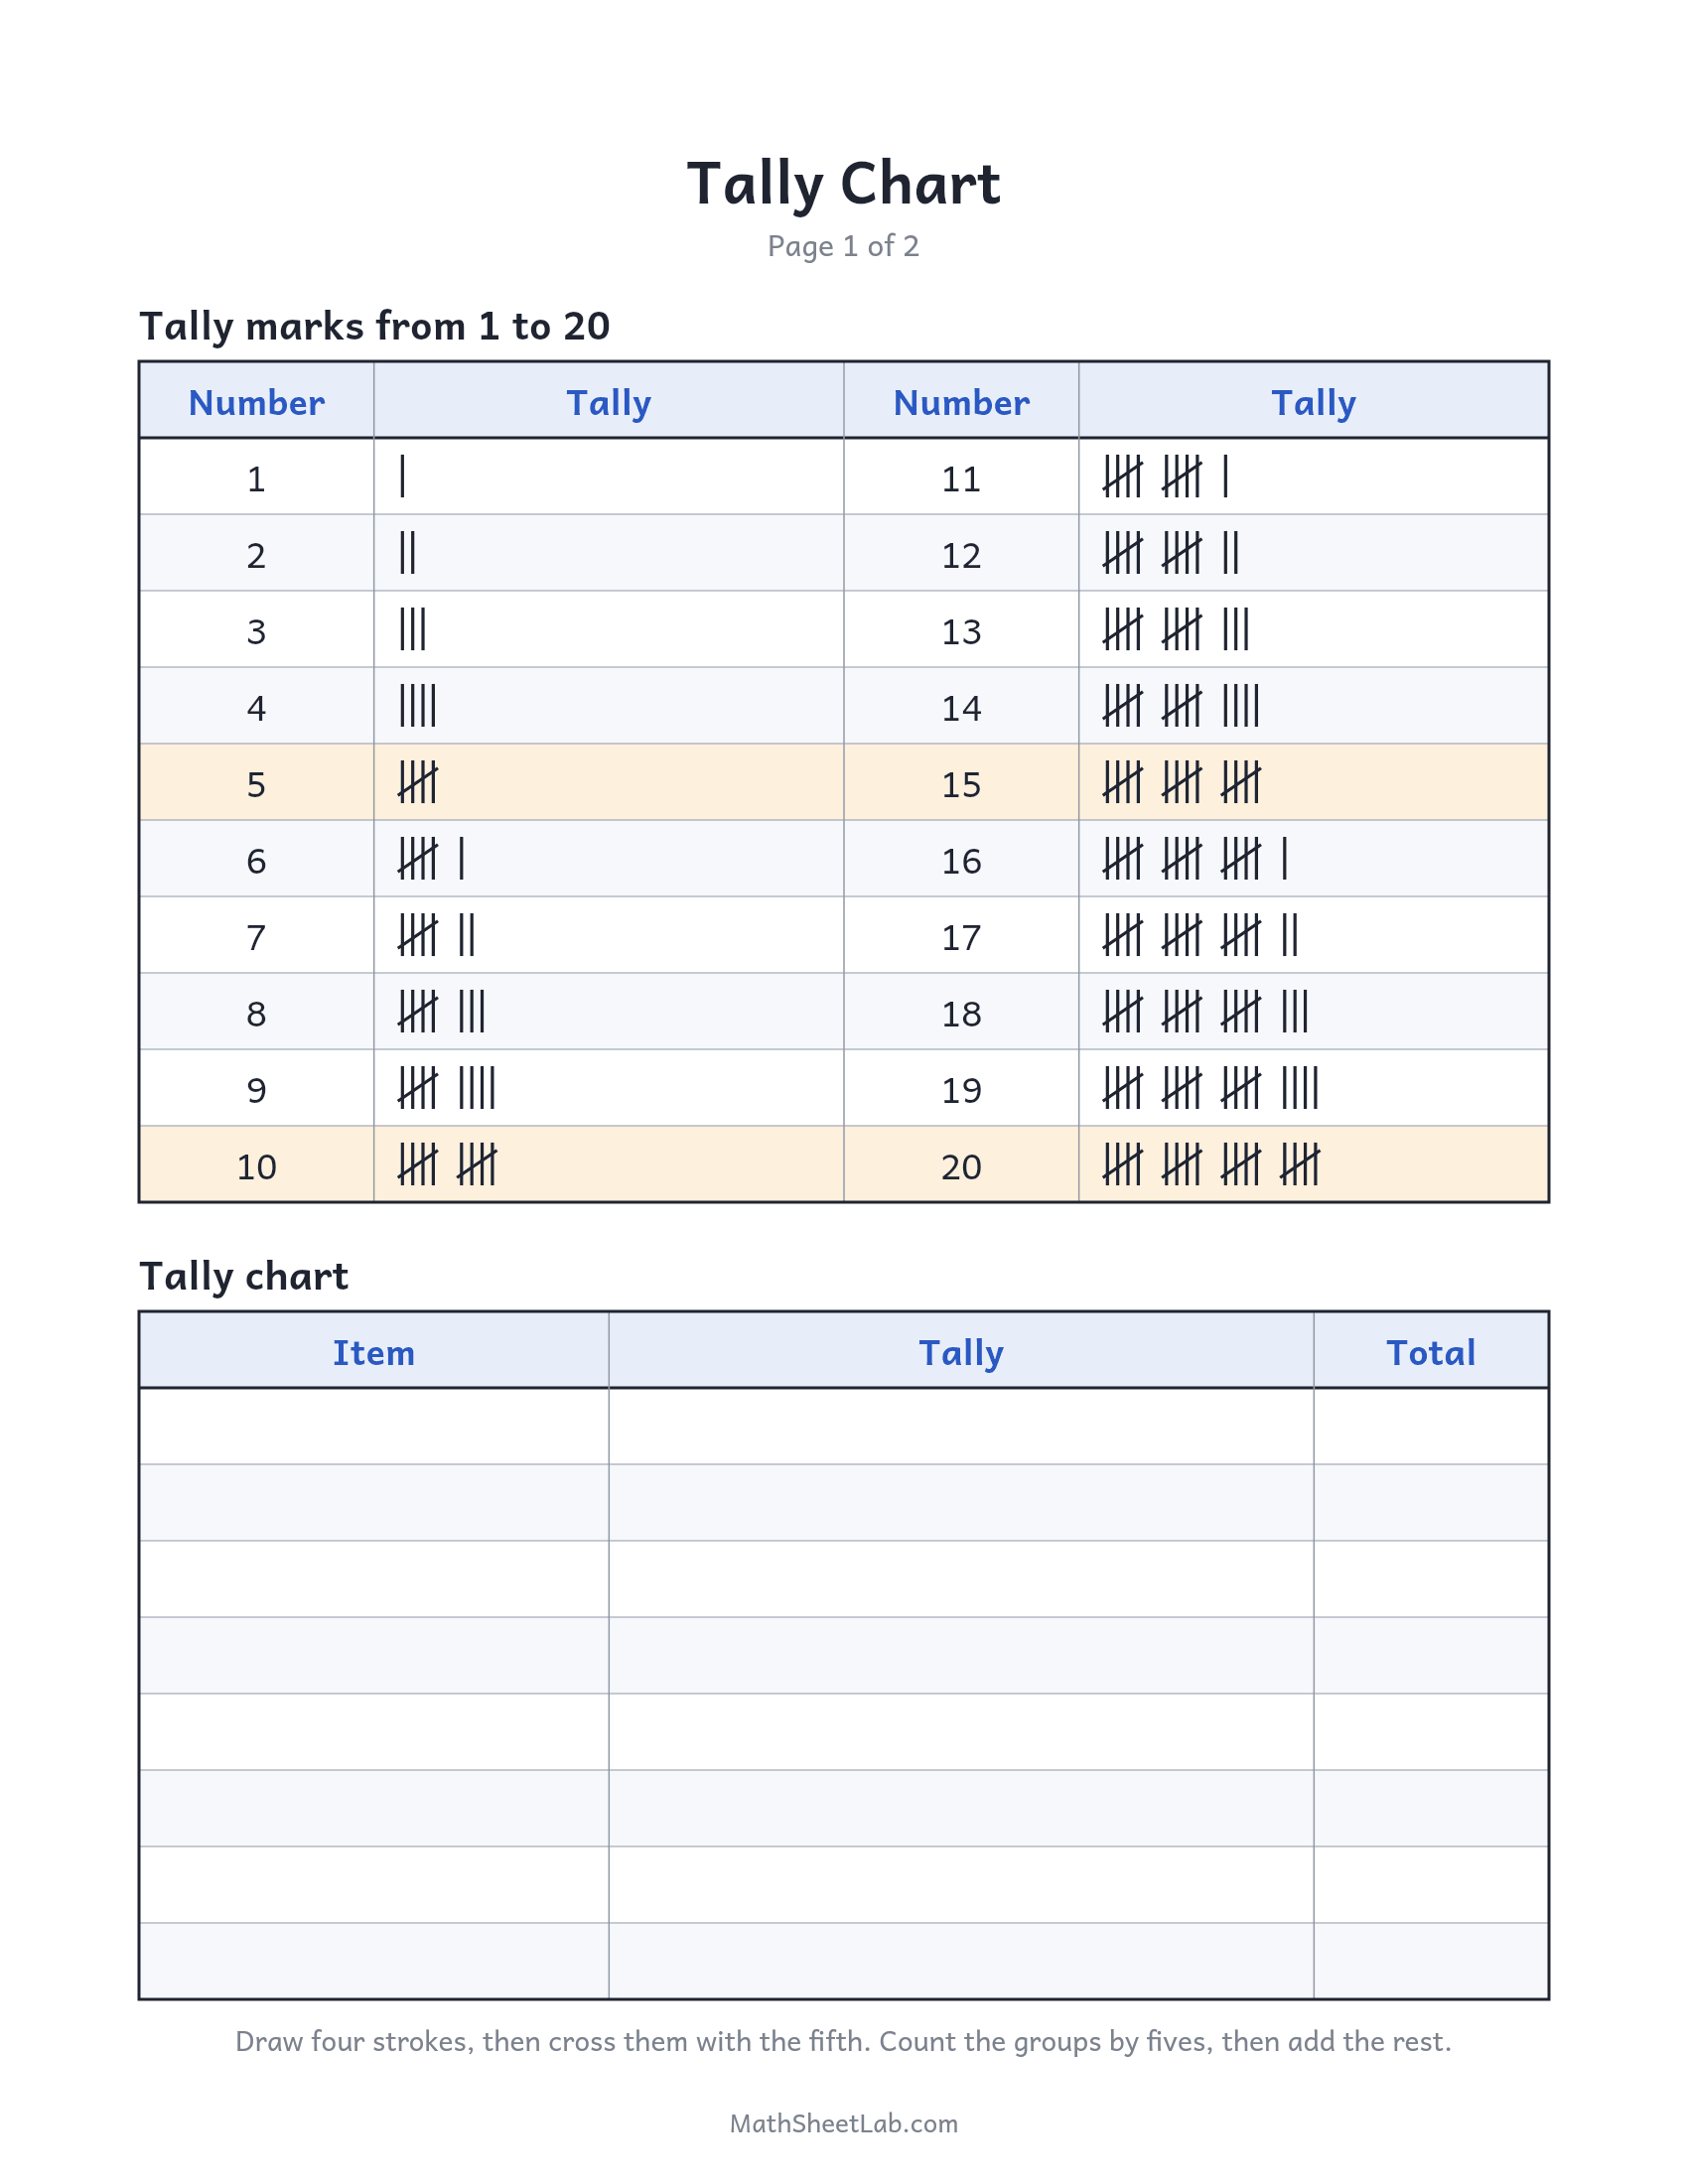
Both pages
Page 1 teaches the marks and has a short blank chart. Page 2 has a finished example to copy from and a longer chart with room for ten categories and a Total row.
-
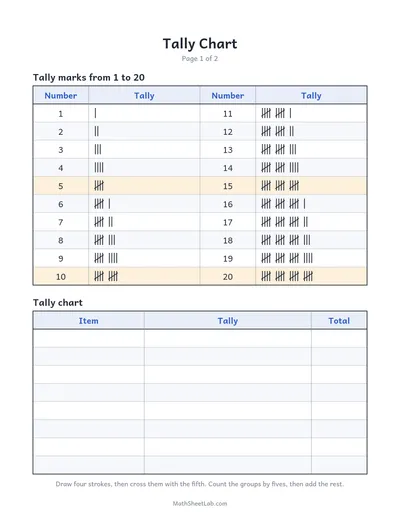
Tally marks and blank chart
-
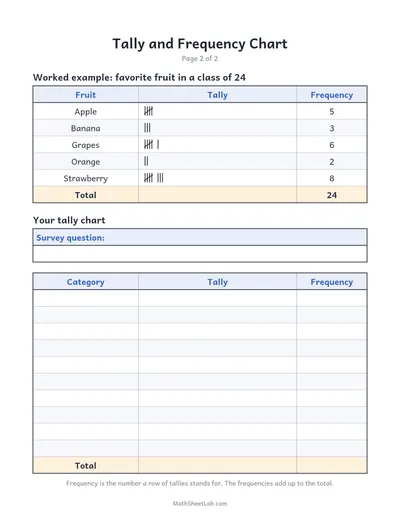
Frequency chart and example
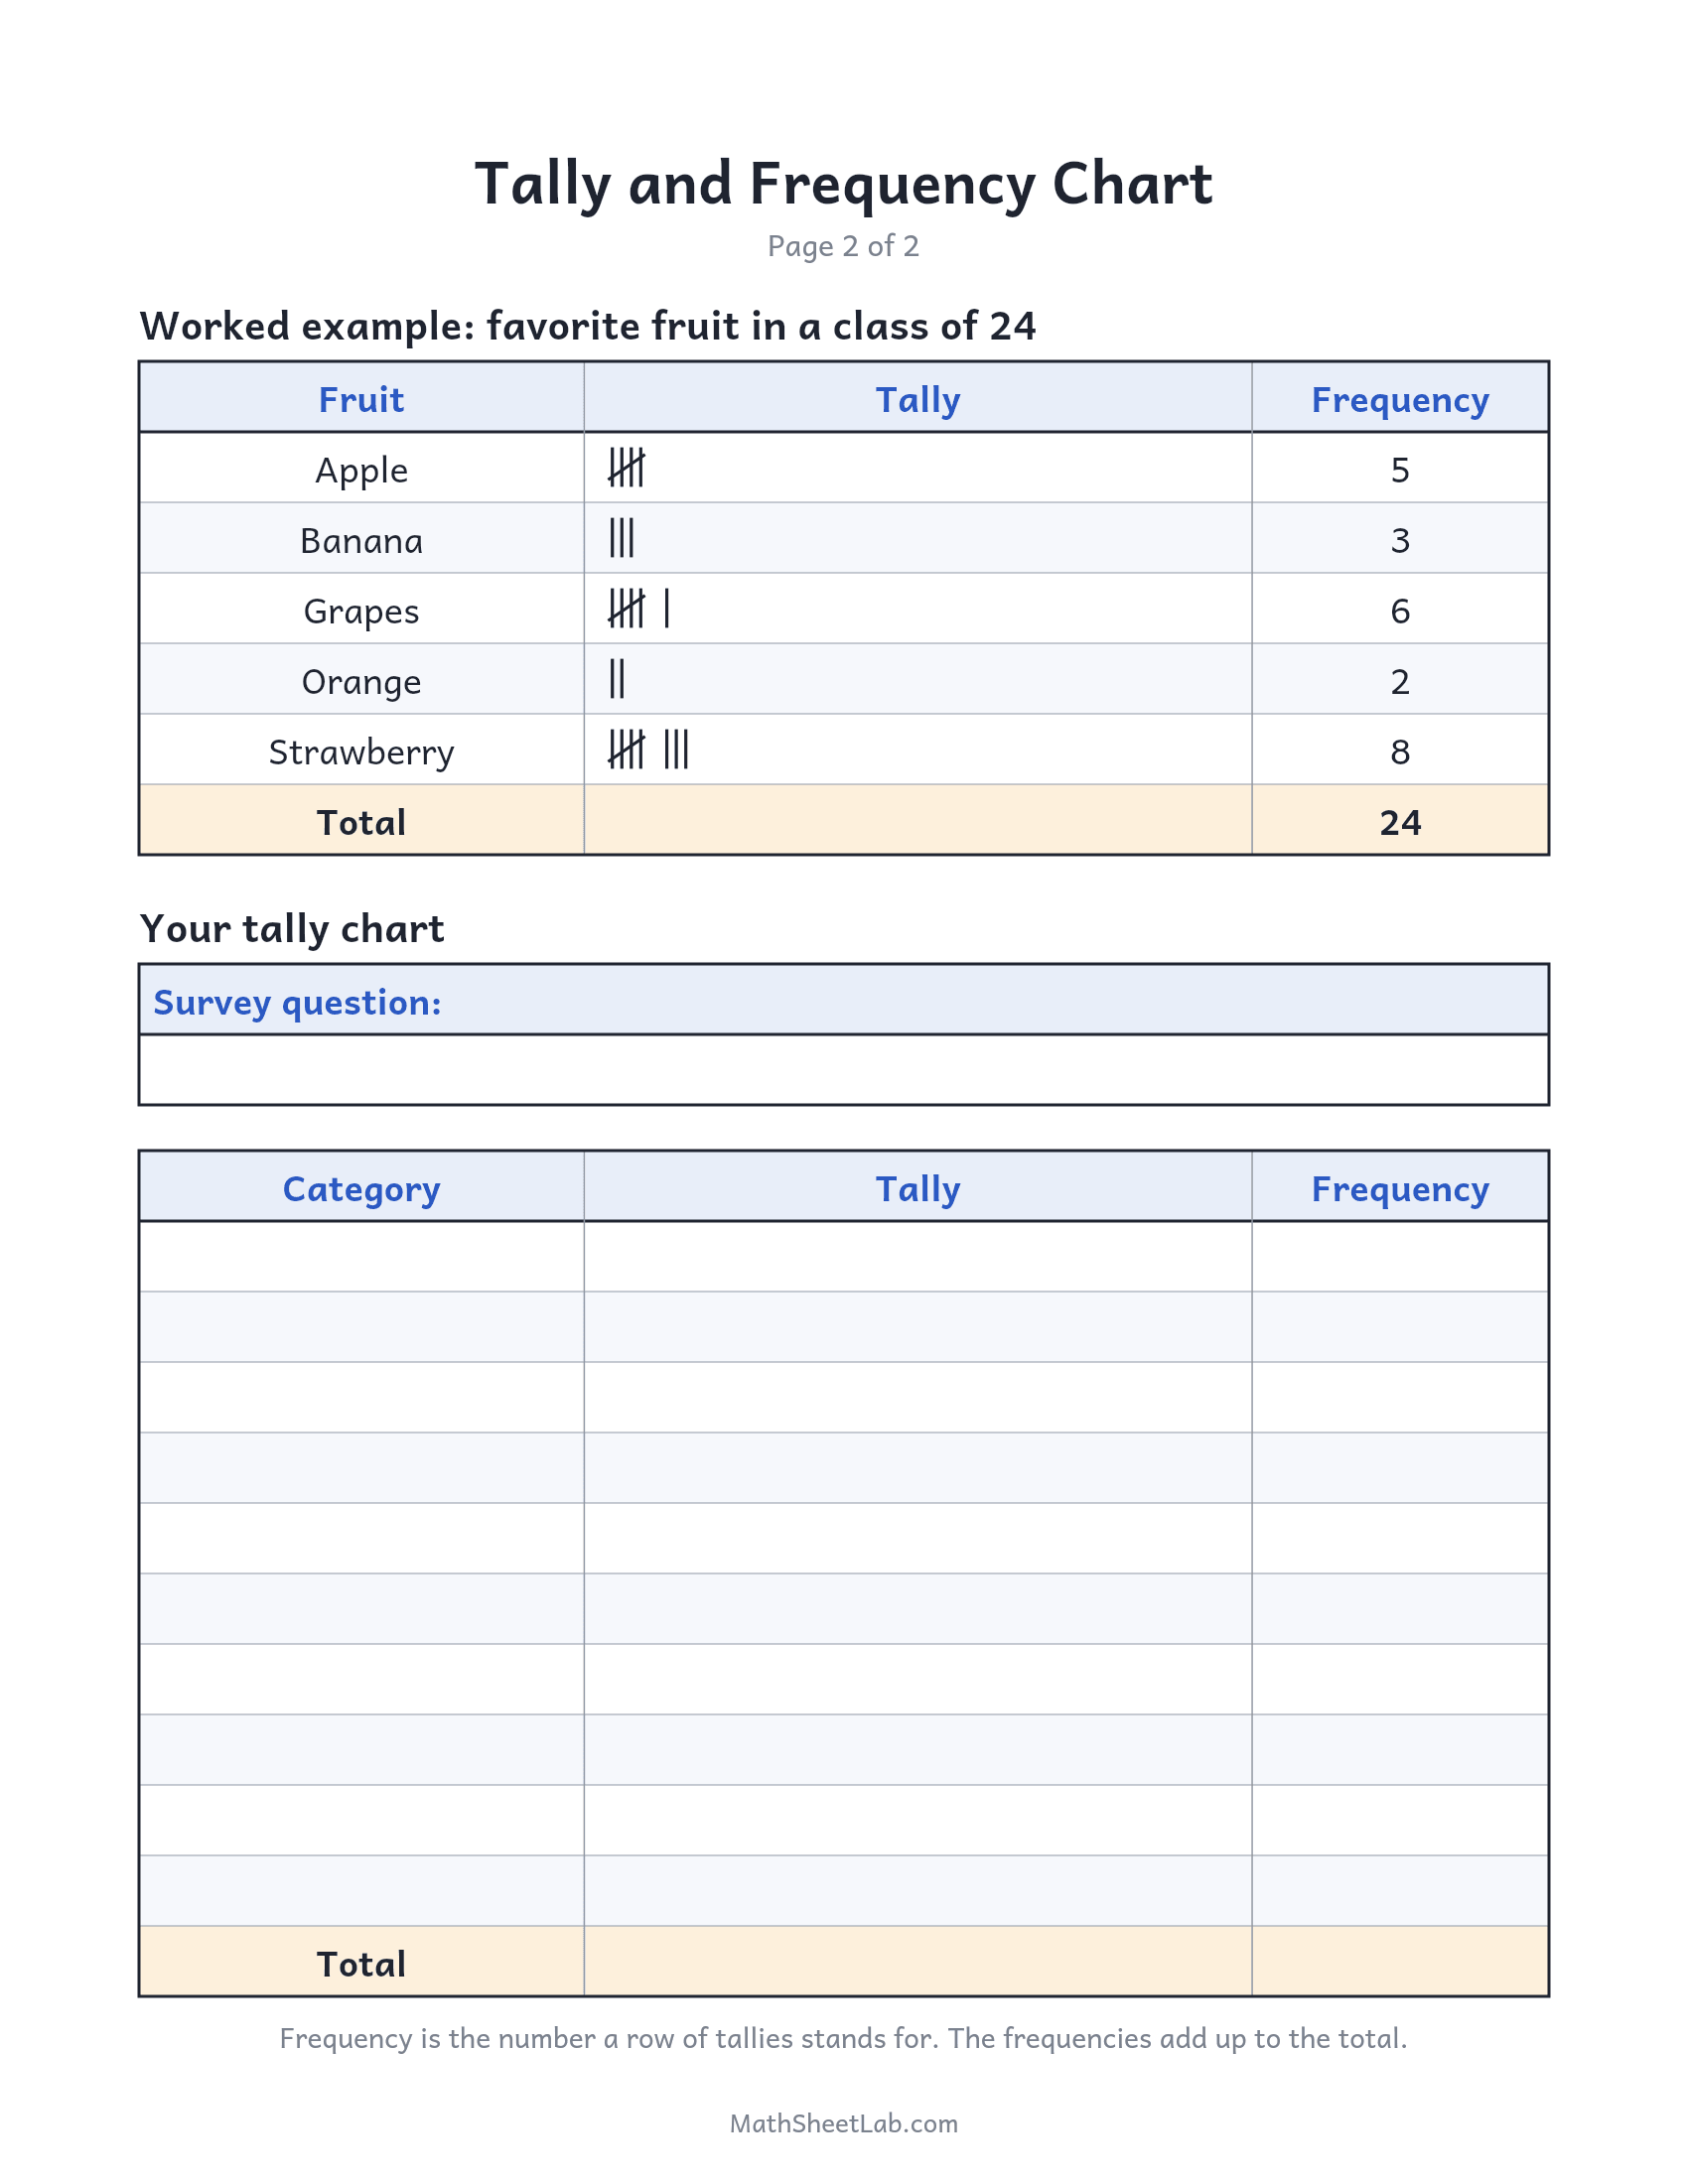
How to print it
- Open the print view. Press Print for a clean print-ready view of page 1, or download it as a PDF or PNG. The other pages are in the gallery below, with a button to download them all.
- Fit to page. In the print dialog choose “Fit to page” — the chart is laid out for US Letter and scales cleanly onto A4.
- Copy freely. Print or photocopy as many as you need for home, classroom or tutoring use. It is free, with no sign-up.
About the tally chart
A tally chart records a count while it happens. Each answer gets one stroke in its row, and every fifth stroke crosses the four before it, so the marks fall into groups of five that are counted 5, 10, 15 and then the strokes left over. Page 1 shows the marks for 1 to 20 above a blank chart for a first survey, such as favorite colors or cars passing the window, with a Total column for each row's count. Page 2 calls that count the frequency and adds a Total row underneath as a check, since the frequencies must add up to the number of answers collected. Its worked example is a class of 24 choosing a favorite fruit, which strawberry wins with 8 votes.
Grade level: this chart is used in our 1st grade math worksheets and 2nd grade math worksheets collections.
Frequently asked questions
How do you read a tally chart?
Count the groups of five first, then the single strokes left over. Three groups and two strokes is 5 + 5 + 5 + 2 = 17. If every row starts at the left edge of its box, the longest row shows the most popular answer before anything is counted.
What is the difference between a tally and a frequency?
The tally is the marks made while counting. The frequency is the number they add up to, written as a numeral so rows can be compared, added or graphed.
Why is the fifth mark drawn across the others?
It closes a group of five, so nobody has to count every stroke one by one. The groups are counted in fives, the same skip counting children practice on a hundreds chart.
What grade uses tally charts?
Mostly 1st and 2nd grade, when children sort objects into categories, count them and compare the counts. Picture graphs and bar graphs come next, built from the same frequencies.