Decimal place value chart
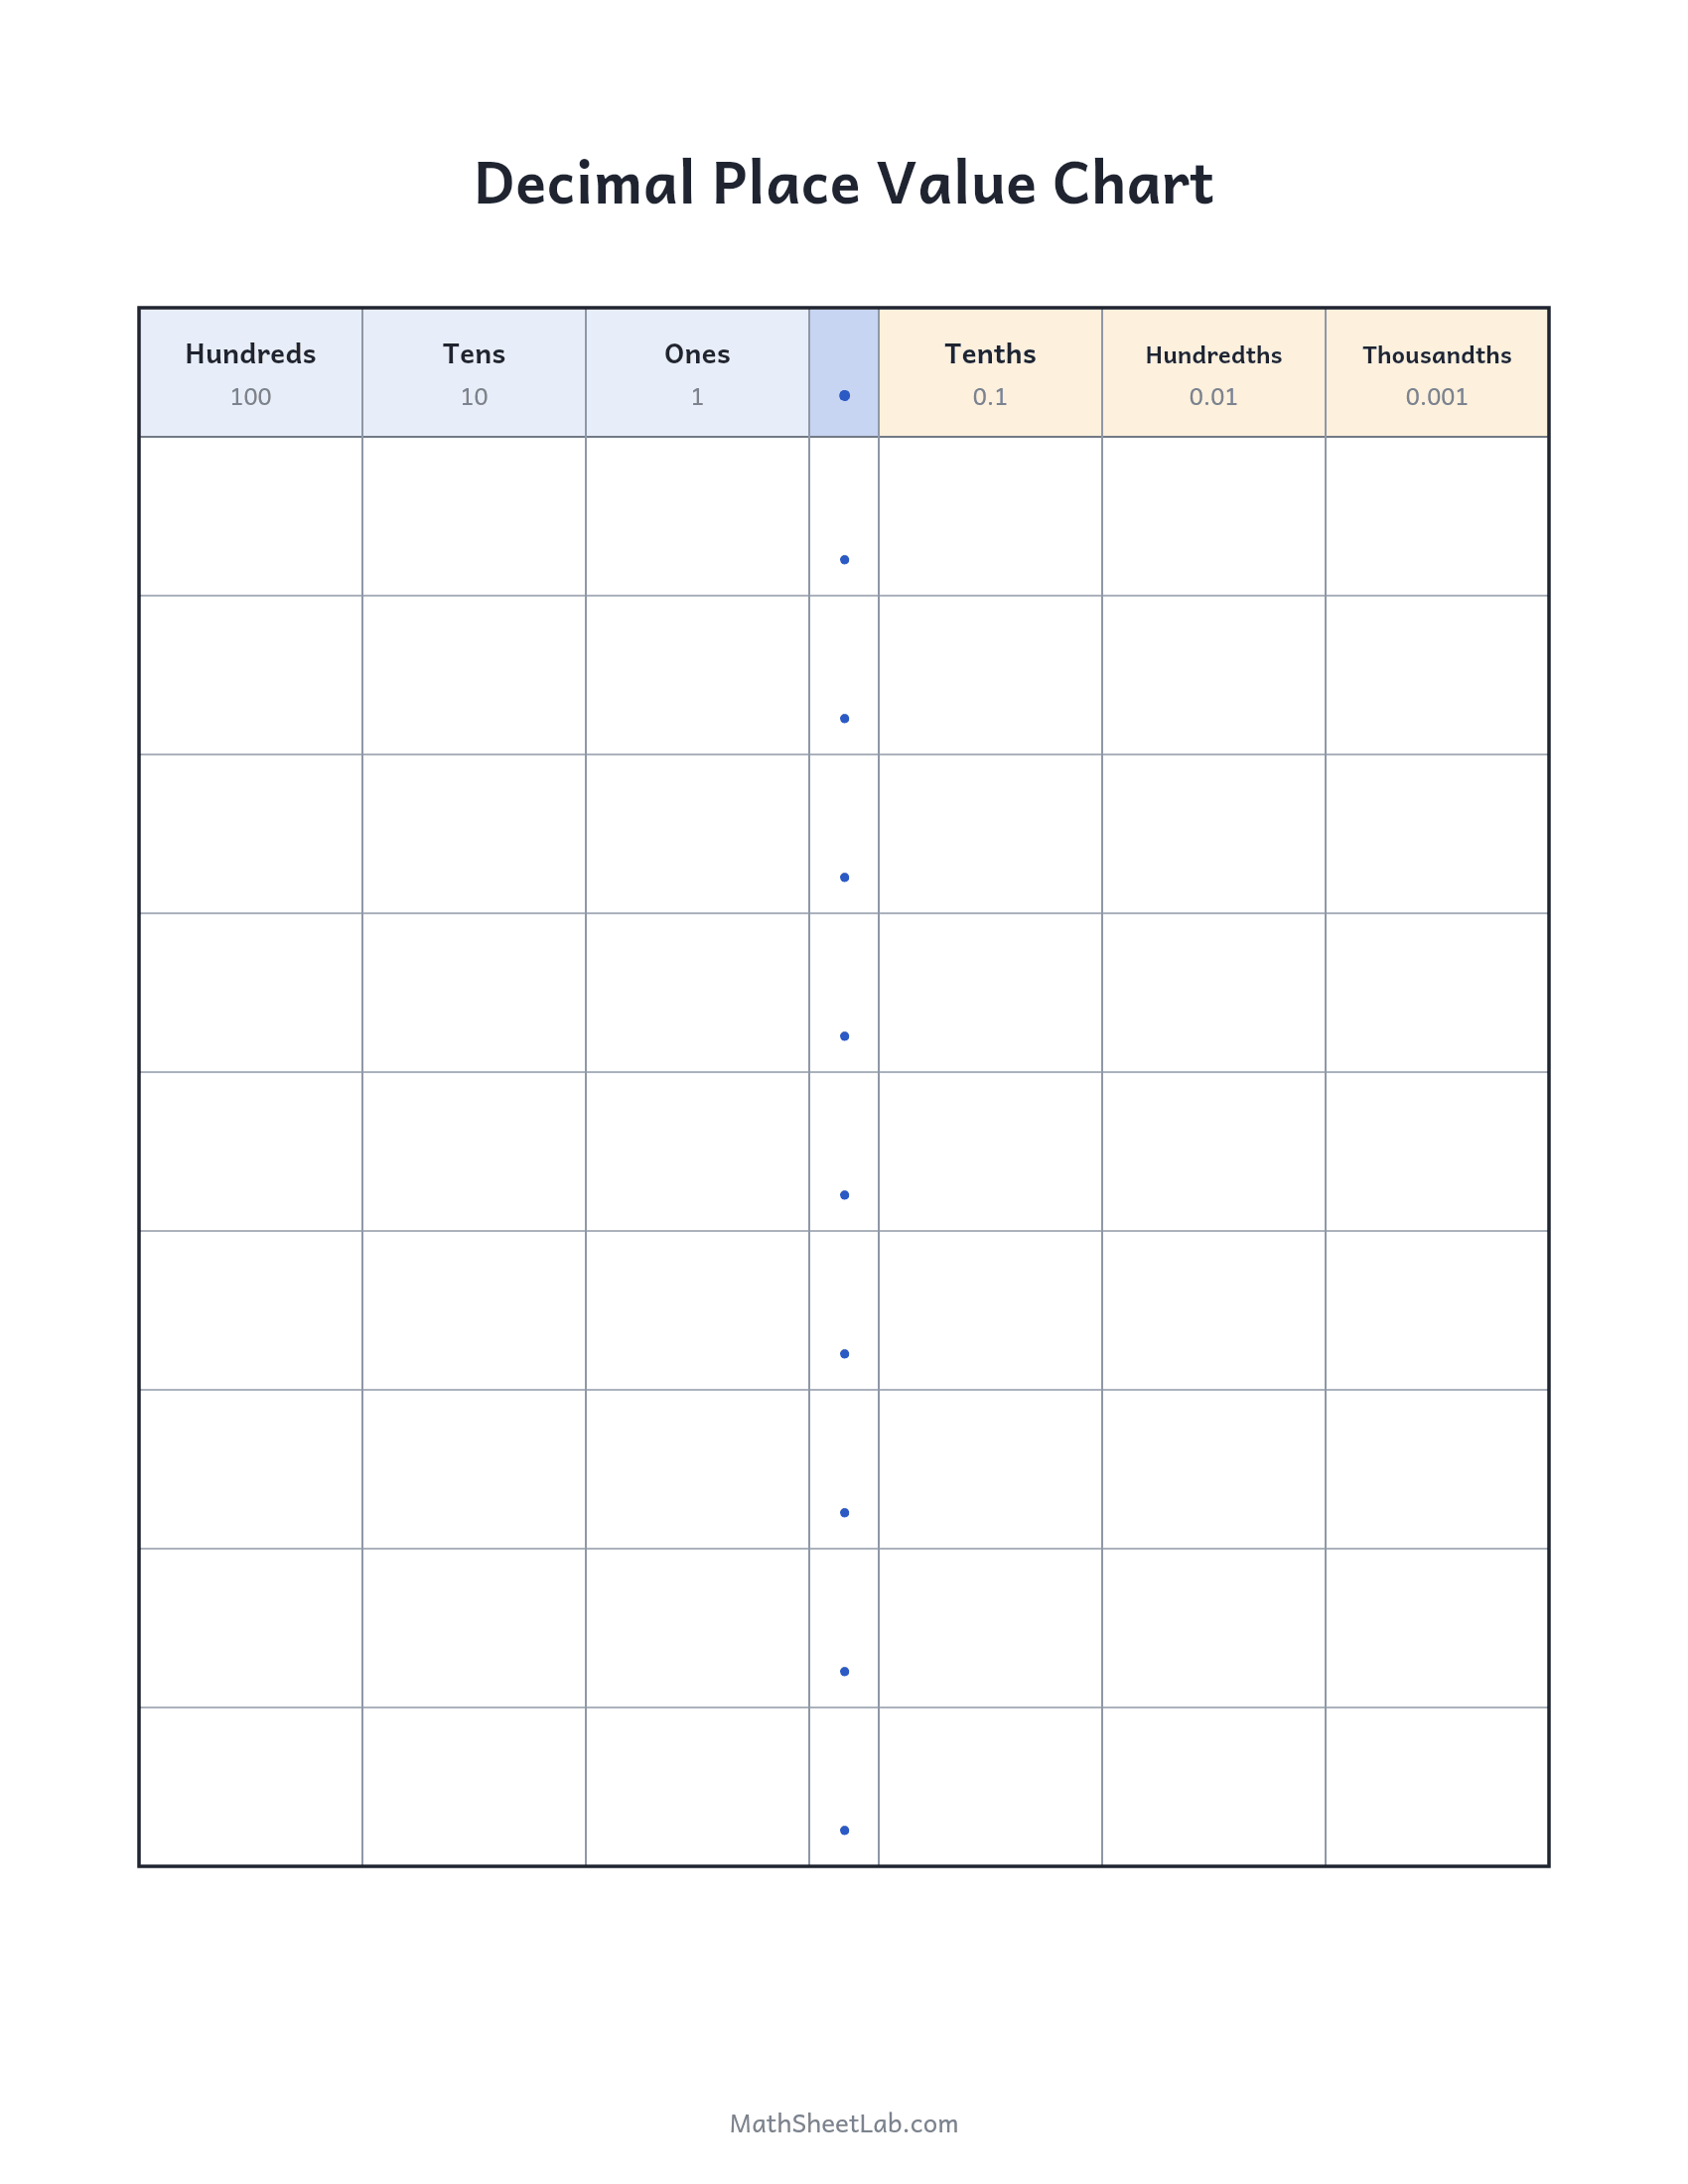
Hundreds through thousandths with the decimal point printed down the middle — write any decimal straight in.
How to print it
- Open the print view. Press Print for a clean print-ready view, or download the PDF or PNG below the chart.
- Fit to page. In the print dialog choose “Fit to page” — the chart is laid out for US Letter and scales cleanly onto A4.
- Copy freely. Print or photocopy as many as you need for home, classroom or tutoring use. It is free, with no sign-up.
About the decimal place value chart
Decimals stop being scary when the chart shows what they are: the same place-value system, continuing past a dot. This chart runs from hundreds to thousandths with each column’s value printed under its label (0.1, 0.01, 0.001) and the decimal point pre-printed in every writing row, so numbers land in the right columns automatically. Dictate “three and forty-two hundredths” and the empty tenths column does the teaching.
Grade level: this chart is used in our 4th grade math worksheets and 5th grade math worksheets collections.
Frequently asked questions
How do you use a decimal place value chart?
One digit per column, decimal point already in place. Reading decimals aloud and writing them in — especially ones with zeros, like 5.03 — is the core exercise.
Why do the decimal columns end in “ths”?
Tenths, hundredths and thousandths are parts of one whole — the mirror image of tens, hundreds and thousands. The chart makes that symmetry visible around the ones column.
What grade uses this chart?
Decimal place value is 4th–5th grade core. For whole numbers only, use the place value chart to millions instead.